
Data Quality, Definitions and Trust
A market needs a different definition for a particular case or adopts a new tool. An urgent reporting request is handled locally because changing the shared model would take too long. Each decision may be reasonable, but together they create a fragmented environment where classifications become increasingly local, reporting logic is scattered and its rules are hard to trace.
In a small team, these can be manageable, but not when scaling them across countries and business units. The person who understands an adjustment in a local CRM may never meet the analyst consolidating the numbers, while the people consuming the report often don't know the underlying systems. Self-service analytics makes information easier to access, including for people who were never involved in defining it, so inconsistencies can reach more decisions without being noticed.
When you try to get a consolidated view, a lead can suddenly mean both a completed form and a contact accepted by sales. Both measures may be useful in their original contexts, yet misleading when treated as equivalent or used to compare conversion rates. Local variation will always exist, but definitions, ownership and the rules for handling exceptions need to be established from the start and maintained as systems change.
These questions extend the broader principles of data governance. Data governance provides the framework, covering the policies, responsibilities and controls around how an organization defines, collects, maintains, protects and uses its data (Abraham et al., 2019; Khatri & Brown, 2010). Analytics governance applies them to how data is measured, analyzed and reported, including the definitions and calculations applied, the quality of the underlying information and the responsibilities for approving changes. In multi-market organizations, the difficulty is expanded by differences in local systems, business processes and requirements, which have to be accommodated without compromising the consistency of group reporting.
A decades-old dilemma
Incompatible business meanings preceded cloud analytics and researchers have long explored the trade-off. Commonly defined data elements and codes help units coordinate but take away some of their freedom to describe their own business, so integration pays off only in some situations (Goodhue et al., 1992). The debate has continued around the split of authority between the center and the units, which depends on the organization's circumstances (Sambamurthy & Zmud, 1999). It is still present in data mesh discussions, where shared standards have to coexist with domain autonomy (Goedegebuure et al., 2024; Bode et al., 2024).
Alongside the organizational debate, data warehouse design addressed part of the problem through how data was integrated and structured for analysis. Bill Inmon's top-down model integrated data from multiple systems into a centralized enterprise warehouse, typically using normalized tables, which then supplied reporting data marts. Ralph Kimball's bottom-up approach organized dimensional models around business processes, such as sales or orders, and connected them through shared, or "conformed", dimensions, such as customers and products, so results could be compared across processes (Inmon, 2005; Kimball Group, n.d.; Ross, 2004).
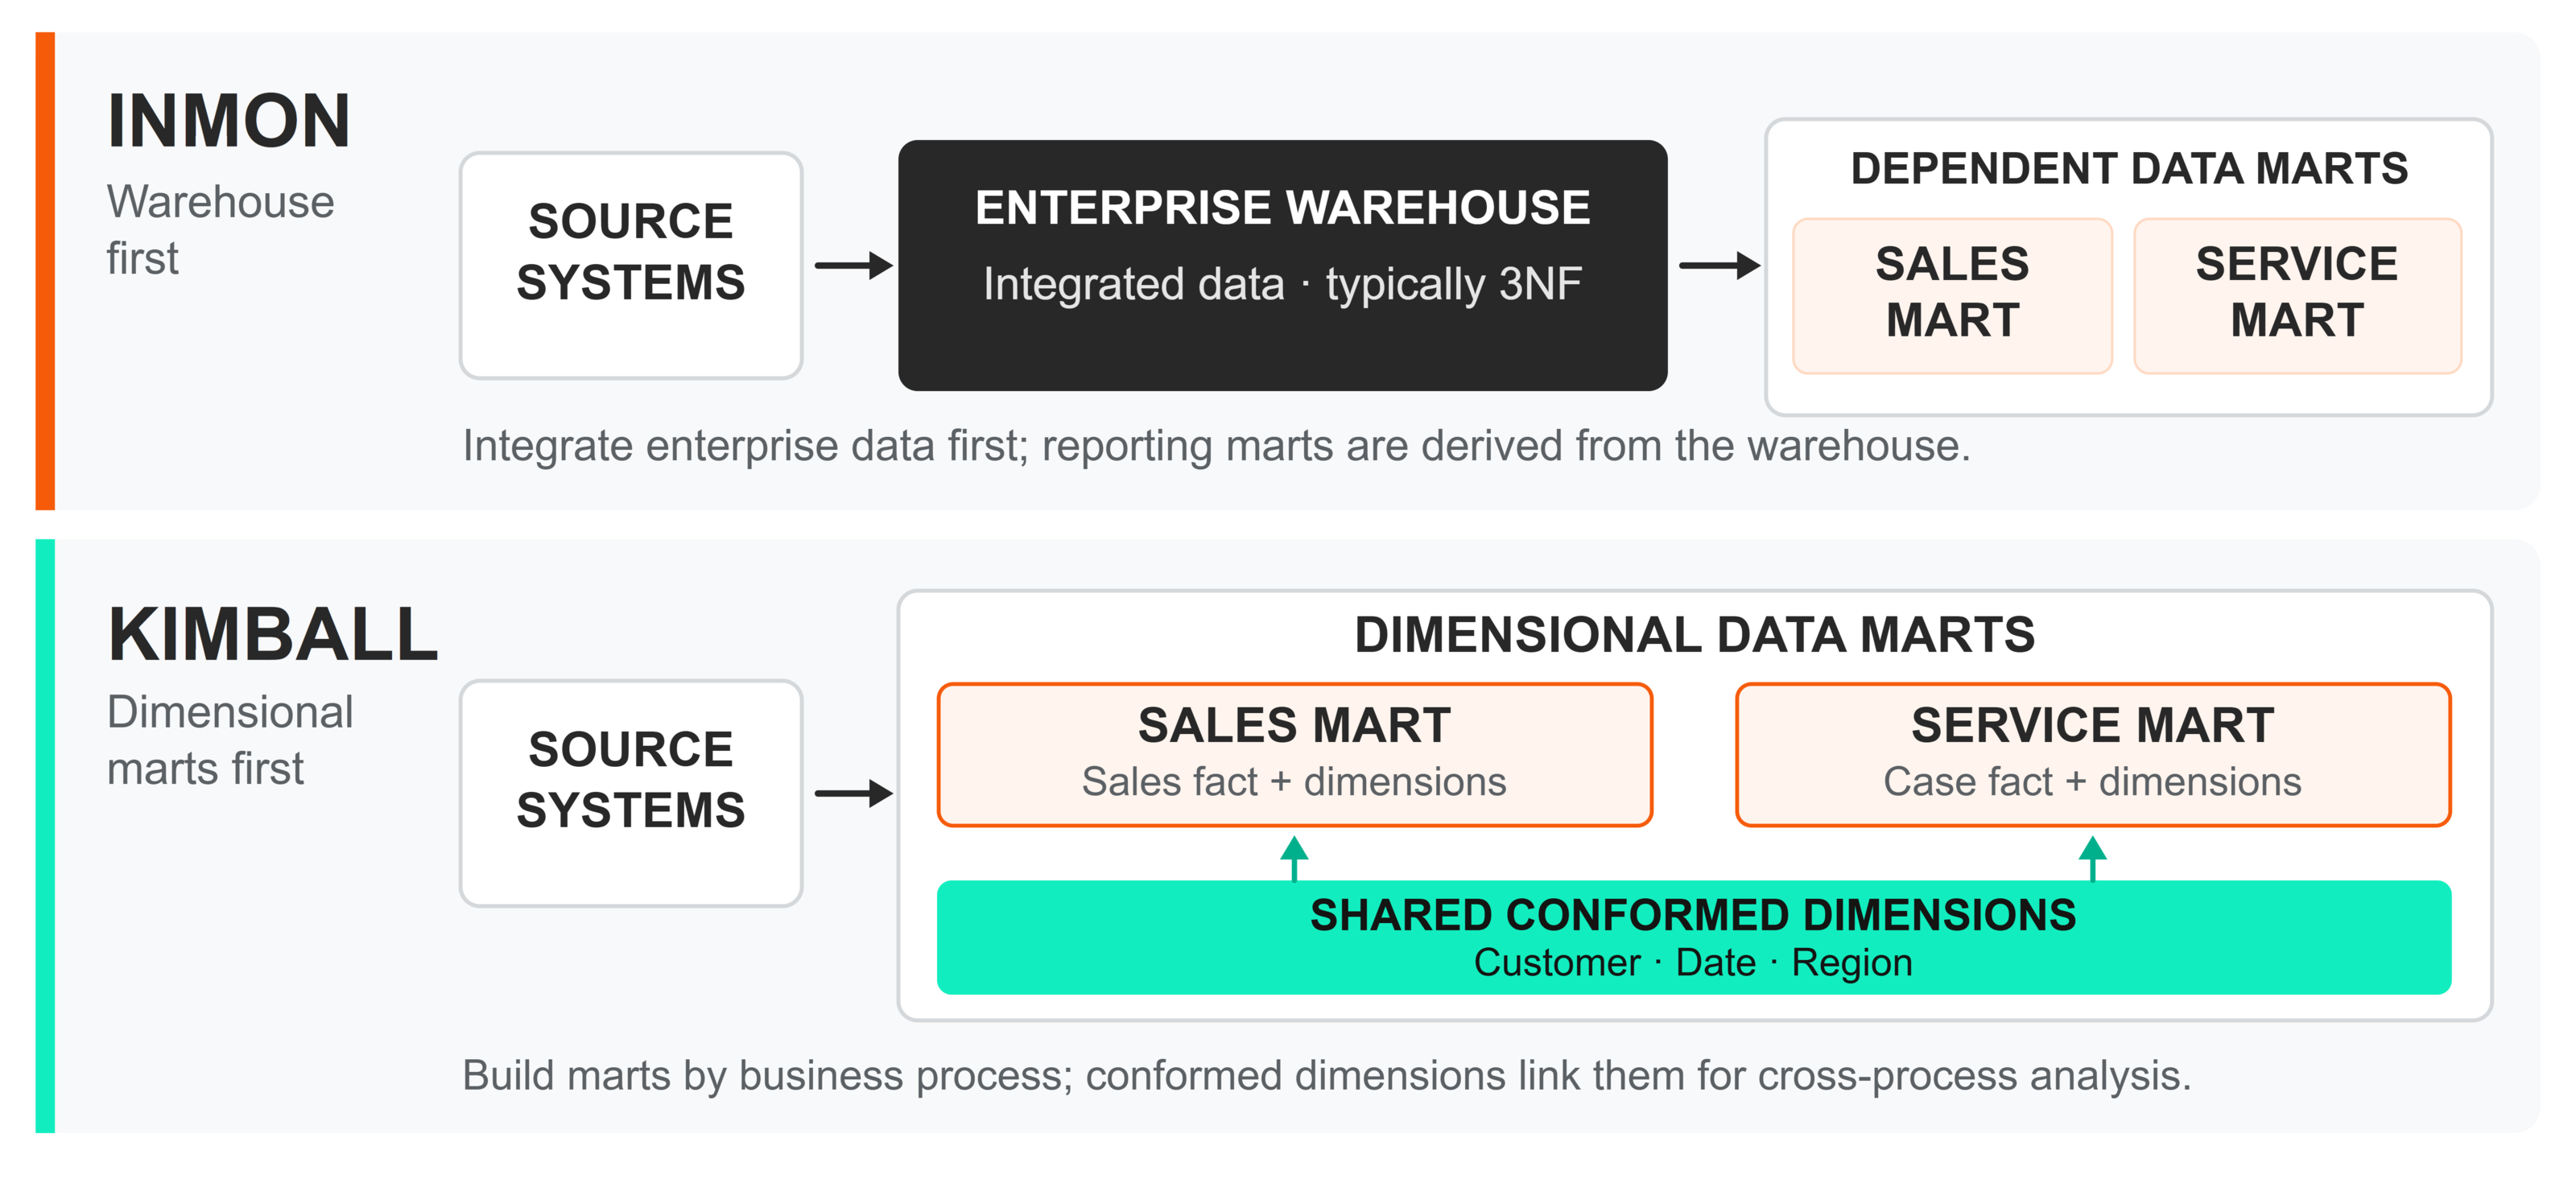
Figure 1. Top-down (Inmon) and bottom-up (Kimball) warehouse architectures, adapted from Inmon (2005) and Kimball Group (n.d.).
Both approaches help make data more consistent, but they concern how data is organized for analysis, not who determines which business definitions and rules should apply. Shared storage does not prevent reports from applying different business rules, while conformed dimensions depend on those rules being agreed and maintained (Ross, 2004). Nor is quality only a question of technical accuracy. Data consumers judge it against the task they need to perform (Wang & Strong, 1996), and a value that is correct in one context can be misinterpreted in another (Madnick et al., 2009). This is a semantic as much as technical challenge.
Because different uses can require different readings of the data, someone has to decide which one governs a group measure. This is a question of decision rights: which decisions must be made about data and who makes them (Weill & Ross, 2004; Khatri & Brown, 2010). The consequences of leaving responsibility unclear are documented. In a review of 25 significant European banks, the European Central Bank (ECB, 2018) found that none had fully implemented the applicable risk-data principles. Responsibility for quality was often unclear between business, control and IT functions, while classifications differed across entities and risk types.
Small choices, big gaps
A mismatch can originate at any point: in the definition of a business outcome, in what was recorded, in the classification assigned to it or in the calculation applied later. Often, the team maintaining a field is assumed to own it, while no one has formally decided who may approve a different interpretation, check the impact on downstream measures or consult the affected markets. In a small organization those people may sit together; across countries, they may work in entirely different functions.
Airbnb describes Finance and Data Science giving different answers to a simple question about which city had the most bookings in the previous week. They were using slightly different tables, metric definitions and business logic. Airbnb responded by rebuilding core data models and developing Minerva, a platform where measures could be defined, reviewed and version-controlled for reuse across reporting and analytics (Chang, 2021).
For Uber, the same city showed different shopping sessions in two reporting tools (6.53 million vs 6.20 million) covering the same period because one used outdated filters that excluded some rider states. In response, they developed uMetric to reuse metric logic and introduced verification committees with domain specialists for important measures, while for less critical ones local teams were allowed more flexibility. The review process became part of the solution (Wang et al., 2021).
Other discrepancies begin with classification. At Colgate-Palmolive, regional and agency teams used different naming conventions for campaigns and products. According to the company's account, around 80% of campaign names initially needed manual remapping before reporting could be consolidated. A common taxonomy, central oversight and input validation brought compliance close to 100%, although there was still work to do on creative-asset metadata (Hercher, 2025; Claravine, 2025).
When systems disagree
Different figures do not always mean that one system is wrong. Google Ads and Google Analytics, for example, can count conversions under different rules and assign them to different reporting dates (Google Ads Help, n.d.). Before trying to make two numbers match, it helps to establish what question each system answers and whether the discrepancy is expected.
HUGO BOSS faced this when its data warehouse and Google Analytics recorded different transaction totals. Its partner, FELD M, identified 33 possible causes and investigated them, including tracking restrictions, duplicate transactions and cancellations. The warehouse was treated as the authoritative source for transactions, while Analytics remained the source for website behavior and marketing attribution. Not every gap could be closed, but the company had a clearer account of the differences and knew which numbers to use for which purpose (FELD M, n.d.-b).
Once each source has a role, the figures still have to be reconciled, including deciding how to handle genuine errors. A manual adjustment may make one report agree with another while leaving no record of what changed or why. The next reporting cycle then inherits an unexplained exception. Reviews of bank risk data have documented material problems related to reconciliation errors, extensive manual adjustments and weak controls (ECB, 2024). The Basel Committee (2020) likewise identified documentation of manual controls and reasons for reconciliation differences among better practices. Keeping that record is not a one-off clean-up either: it has to continue every reporting cycle, across all the markets and systems that feed group figures.
Lost in translation
Markets add further challenges related to comparability and observability. A correct local figure may still be unsuitable for a global comparison. A definition that works perfectly well in one country may describe a different business process in another. Even where teams use the same KPI name, the activity, population or criteria may differ. Research on measurement equivalence makes the same point in cross-country studies: a comparison requires reasonable assurance that the measures capture comparable concepts (Steenkamp & Baumgartner, 1998; Hult et al., 2008).
Markets may also record different proportions of activity. Privacy regulation provides a clear example. Aridor et al. (2023) found that GDPR opt-in reduced the number of consumers observable to an online travel intermediary by 12.5%. In a study of 1,084 firms, Goldberg et al. (2024) found reductions of around 12% in EU page views and revenue recorded by Adobe Analytics. Their analysis separates changes in data recording from changes in real outcomes, so the entire reduction should not be treated as missing tracking. Google Analytics can model some activity missing because of consent, but eligibility depends on the individual property's implementation and data volumes (Google Analytics Help, n.d.). Two markets can follow the same tracking specification without having equivalent measurement coverage.
It’s important to accommodate different local requirements. But to keep a common measurement, the group still needs to decide what can be consolidated, where exceptions are justified, and how differences in coverage should appear in reporting. Imposing a group label on a commercially different process can hide a difference just as easily as leaving every market to use its own definition.
Deciding what can be compared
A global KPI should include markets whose contributions represent equivalent business events, populations and counting periods. A local field name may be reconciled through an approved mapping; a different stage of the customer journey cannot be made equivalent by giving it the same label. Where equivalence has not been established, the local measure stays separate, and the group total should show which markets and periods it covers.
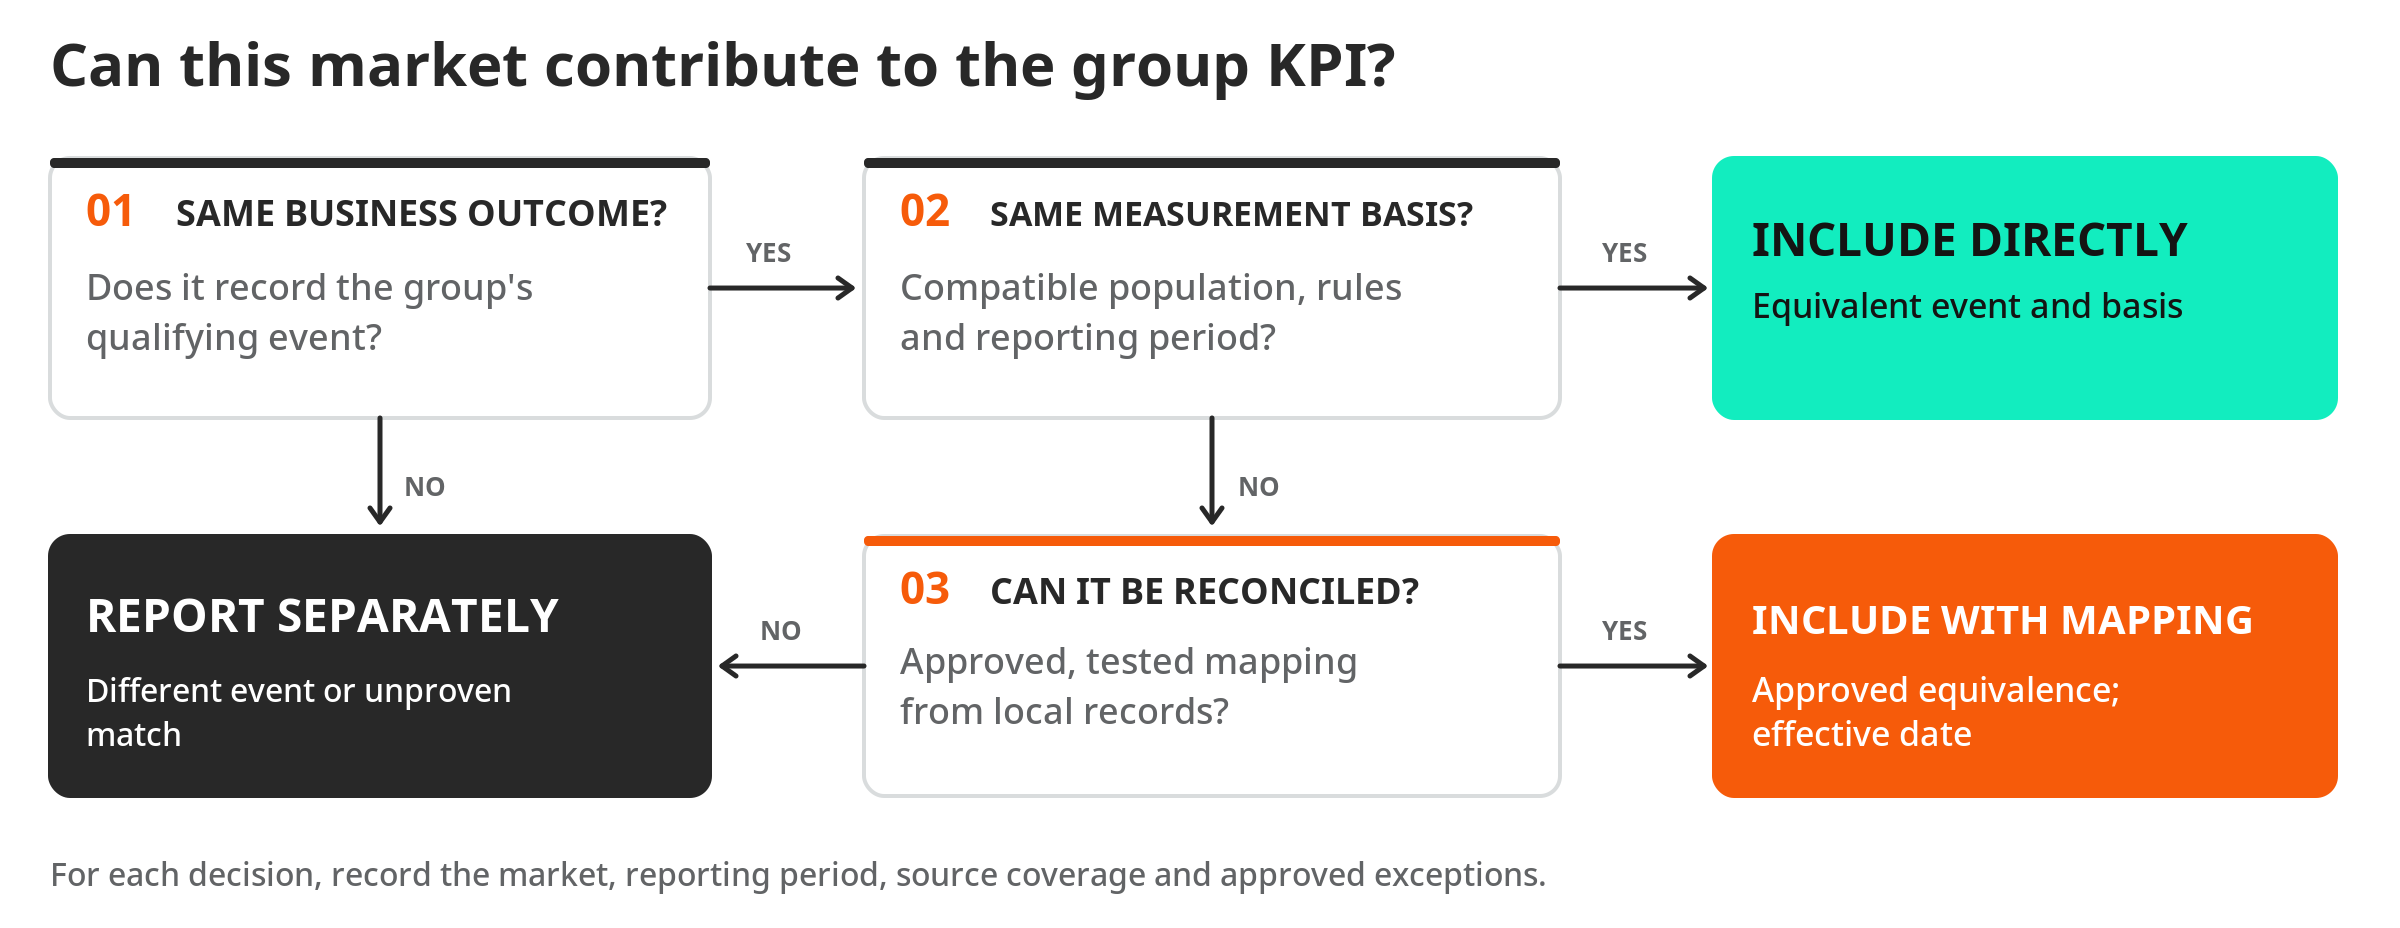
Figure 2. Proposed decision sequence for cross-market reporting.
Take the qualified leads measure mentioned earlier as an example. A group may define them as contacts accepted by sales, but a local market may have an explicit acceptance stage, while another uses a different status that appears equivalent but follows slightly different criteria. Some markets may only record form submissions. Before combining these figures, business owners need to confirm the different stages and their localized meanings, and coordinate with data teams to properly and preferably structurally map these to the group definition. In our example, the numbers of the market that recorded only form submissions cannot be compared or combined with the other two even if they used the same label. If that market starts capturing acceptance in July, it can contribute to the group KPI from that point, but its earlier form submissions cannot be treated retrospectively as qualified leads; they need to be kept separate.
This brings us back to responsibility. Market teams understand the processes behind their data, but approval of a common definition and any exceptions needs to sit with an agreed business owner. Technical teams can validate the mappings, while those responsible for group reporting need to know which markets and periods can legitimately be included. These responsibilities may be distributed differently across organizations, but they need to be established rather than assumed (Fadler & Legner, 2022).
Keeping the agreement in use
The agreement behind a group KPI sits within wider data governance. Policies also determine how data is collected, classified, accessed, shared, retained and deleted, while security and privacy requirements restrict what can be used across markets. Those questions have their own owners and controls. For cross-market analytics, the following five controls provide a proposed working arrangement for maintaining shared definitions, responsibilities and approved local differences. They draw on established governance research, particularly around decision rights and the arrangements needed to put them into practice (Khatri & Brown, 2010; Tallon et al., 2013).
| Control |
Decision |
Evidence to maintain |
| Shared meaning |
What qualifies for comparison? |
Definition, population, exclusions and time basis |
| Decision rights |
Who approves definitions and changes? |
Named owner, approvals and consultations |
| Source and lineage |
Where is the group measure calculated? |
Approved source path and market mappings |
| Quality and reconciliation |
Can the number be used for this decision? |
Checks, coverage and discrepancy history |
| Local exceptions and versions |
What differs, and from when? |
Approved exceptions, effective dates and review record |
Table 1. A working agreement for priority cross-market KPIs.
These controls need to remain connected when something changes. An approved local exception, for example, has to reach the source mapping, metric calculation and affected reports, with an effective date where the change breaks historical comparability. Otherwise the documented rule can change while the next dashboard refresh still follows the old one.
A reasonable starting scope is the measures used for important decisions or repeatedly disputed between teams. The relevant owners can then review the markets supplying each measure, record the approved mappings and exceptions and check that changes have reached the data and reports, rather than being handled separately each time a discrepancy appears.
Where today's tools help
The controls described above can be implemented across different parts of the data and analytics environment, with today's platforms providing capabilities that previously required more custom development. Some of the capabilities Airbnb and Uber built internally are now available through shared semantic models and metric layers. Power BI reports can reuse certified semantic models, while dbt's Semantic Layer and Databricks' Unity Catalog metric views allow measures, dimensions and filters to be defined centrally and reused across reporting interfaces (Microsoft, n.d.; dbt Labs, n.d.; Databricks, 2026). This helps prevent the same calculation from being recreated differently across reports and makes approved changes easier to apply.
Earlier in the data flow, some of the same inconsistencies can affect how customer information is combined and used, including for purposes beyond reporting. In marketing, enterprise customer data platforms (CDPs) can help bring together customer profiles, identifiers and events from different sources and markets, applying common rules for identity resolution, segmentation and activation. Adobe Real-Time CDP, for example, uses merge policies to determine how information from different sources is combined, alongside controls over permitted data uses (Adobe, 2026a; 2026b). Given the discrepancies that can already exist between source systems, having agreed rules at this stage can prevent some of them from carrying into customer profiles and downstream applications. These rules also affect analytics when the consolidated data is used for measurement.
Other capabilities help maintain the agreement over time. Data contracts, quality tests and monitoring can check whether sources continue to meet requirements, business glossaries and catalogs can connect definitions with data assets, owners and lineage, making it easier to identify which systems and reports depend on a particular field or measure (Collibra, 2026; OpenMetadata, n.d.).
But these systems may each be applying a different part of the same business rule. A mapping approved in a catalog may still be implemented differently in a transformation or metric model, while automated checks continue to pass because the underlying data structure has not changed. There is also a difference between detecting an invalid value and recognizing that a valid value no longer describes the intended business outcome. The people who know the local processes are still needed for those decisions, and changes need to reach the systems and reports that depend on them, with the reasoning behind them recorded.