
Technical SEO for Complex Websites: A Guide for Enterprise Marketing Teams
Enterprise marketing teams managing large, multi-language websites face a different class of SEO challenge.
»READ MORE
Core Web Vitals are often treated as a technical scorecard, but for CMOs they reveal something more useful: how much friction customers encounter before a campaign, product page or checkout can do its job. This article explains the business impact of Core Web Vitals and shows how marketing leaders can connect performance with SEO, conversion efficiency and brand trust.

In many organizations, web performance appears only when a Lighthouse score turns red or an SEO report raises a warning. That makes it easy to treat the issue as technical housekeeping, separate from campaign planning, media efficiency and revenue. Yet a slow product page, a delayed filter or a shifting checkout button introduces friction at the exact moment a customer is deciding whether to continue. For FMCG and retail brands operating across markets, that friction is repeated at scale across devices, connections, templates and campaign peaks.
This article is written for CMOs and VP-level marketing leaders who need to understand performance without turning an executive conversation into a technical review. It explains what the three Core Web Vitals measure, where their commercial impact appears and how to build a practical governance model around them. The objective is not to make marketing own every technical fix; it is to help marketing decide where performance deserves investment, how success should be measured and how it fits within a broader digital strategy.
Google's current Core Web Vitals cover three moments in the customer experience:
Largest Contentful Paint (LCP) - measures how quickly the main content becomes visible and should occur within 2.5 seconds.
Interaction to Next Paint (INP) - measures how quickly a page responds after a click, tap or key press and should be no more than 200 milliseconds.
Cumulative Layout Shift (CLS) - measures unexpected movement and should remain at 0.1 or below.
These thresholds are assessed at the 75th percentile, which means the experience should be good for at least three quarters of real visits rather than only for an ideal device in a test environment
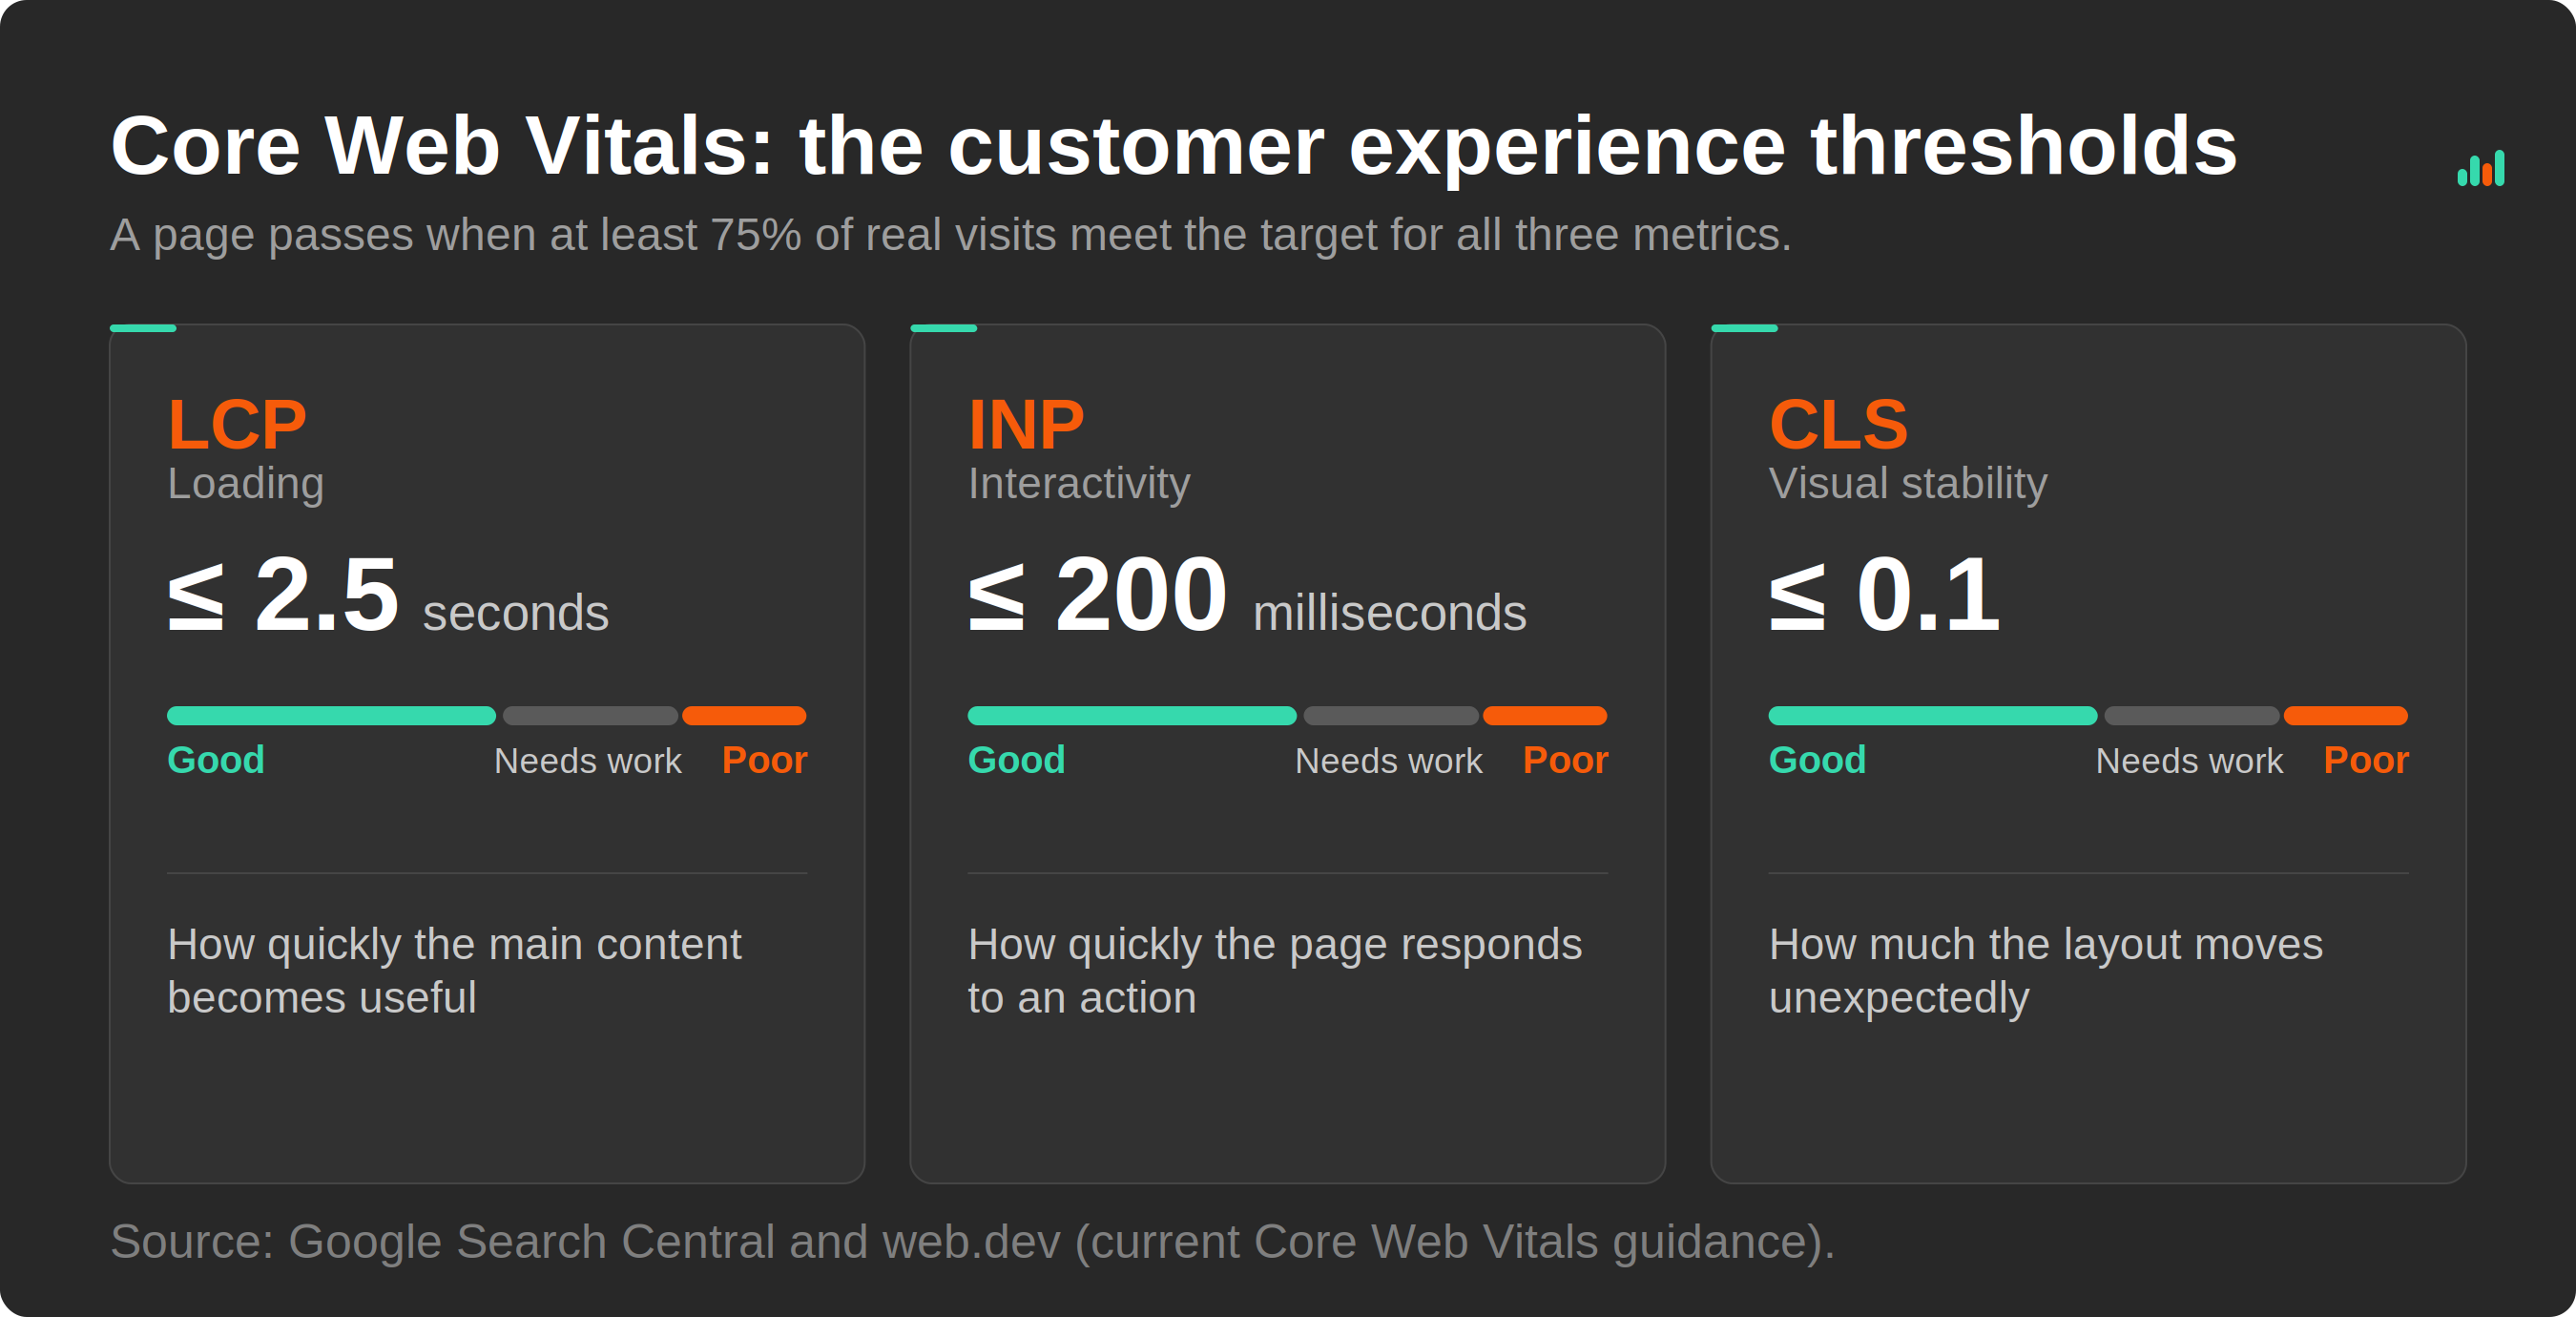
Figure 1. Current Core Web Vitals thresholds. Adapted from Google Search Central and web.dev.
The commercial evidence is strong enough to justify attention, but it should be used with care. A Google-commissioned Deloitte study, summarized on web, dev, analyzed more than 30 million mobile sessions and found that a 0.1-second improvement across key speed measures was associated with an 8.4% increase in retail conversion and 9.2% higher consumer spend (average order value). In a separate A/B test, Vodafone reported 8% more sales after improving LCP by 31%, alongside a 15% improvement in the rate at which visitors progressed to the next step. These are not universal multipliers that can be copied into every business case. They are evidence that the quality of the digital experience can influence the return generated from traffic a brand has already paid to attract.
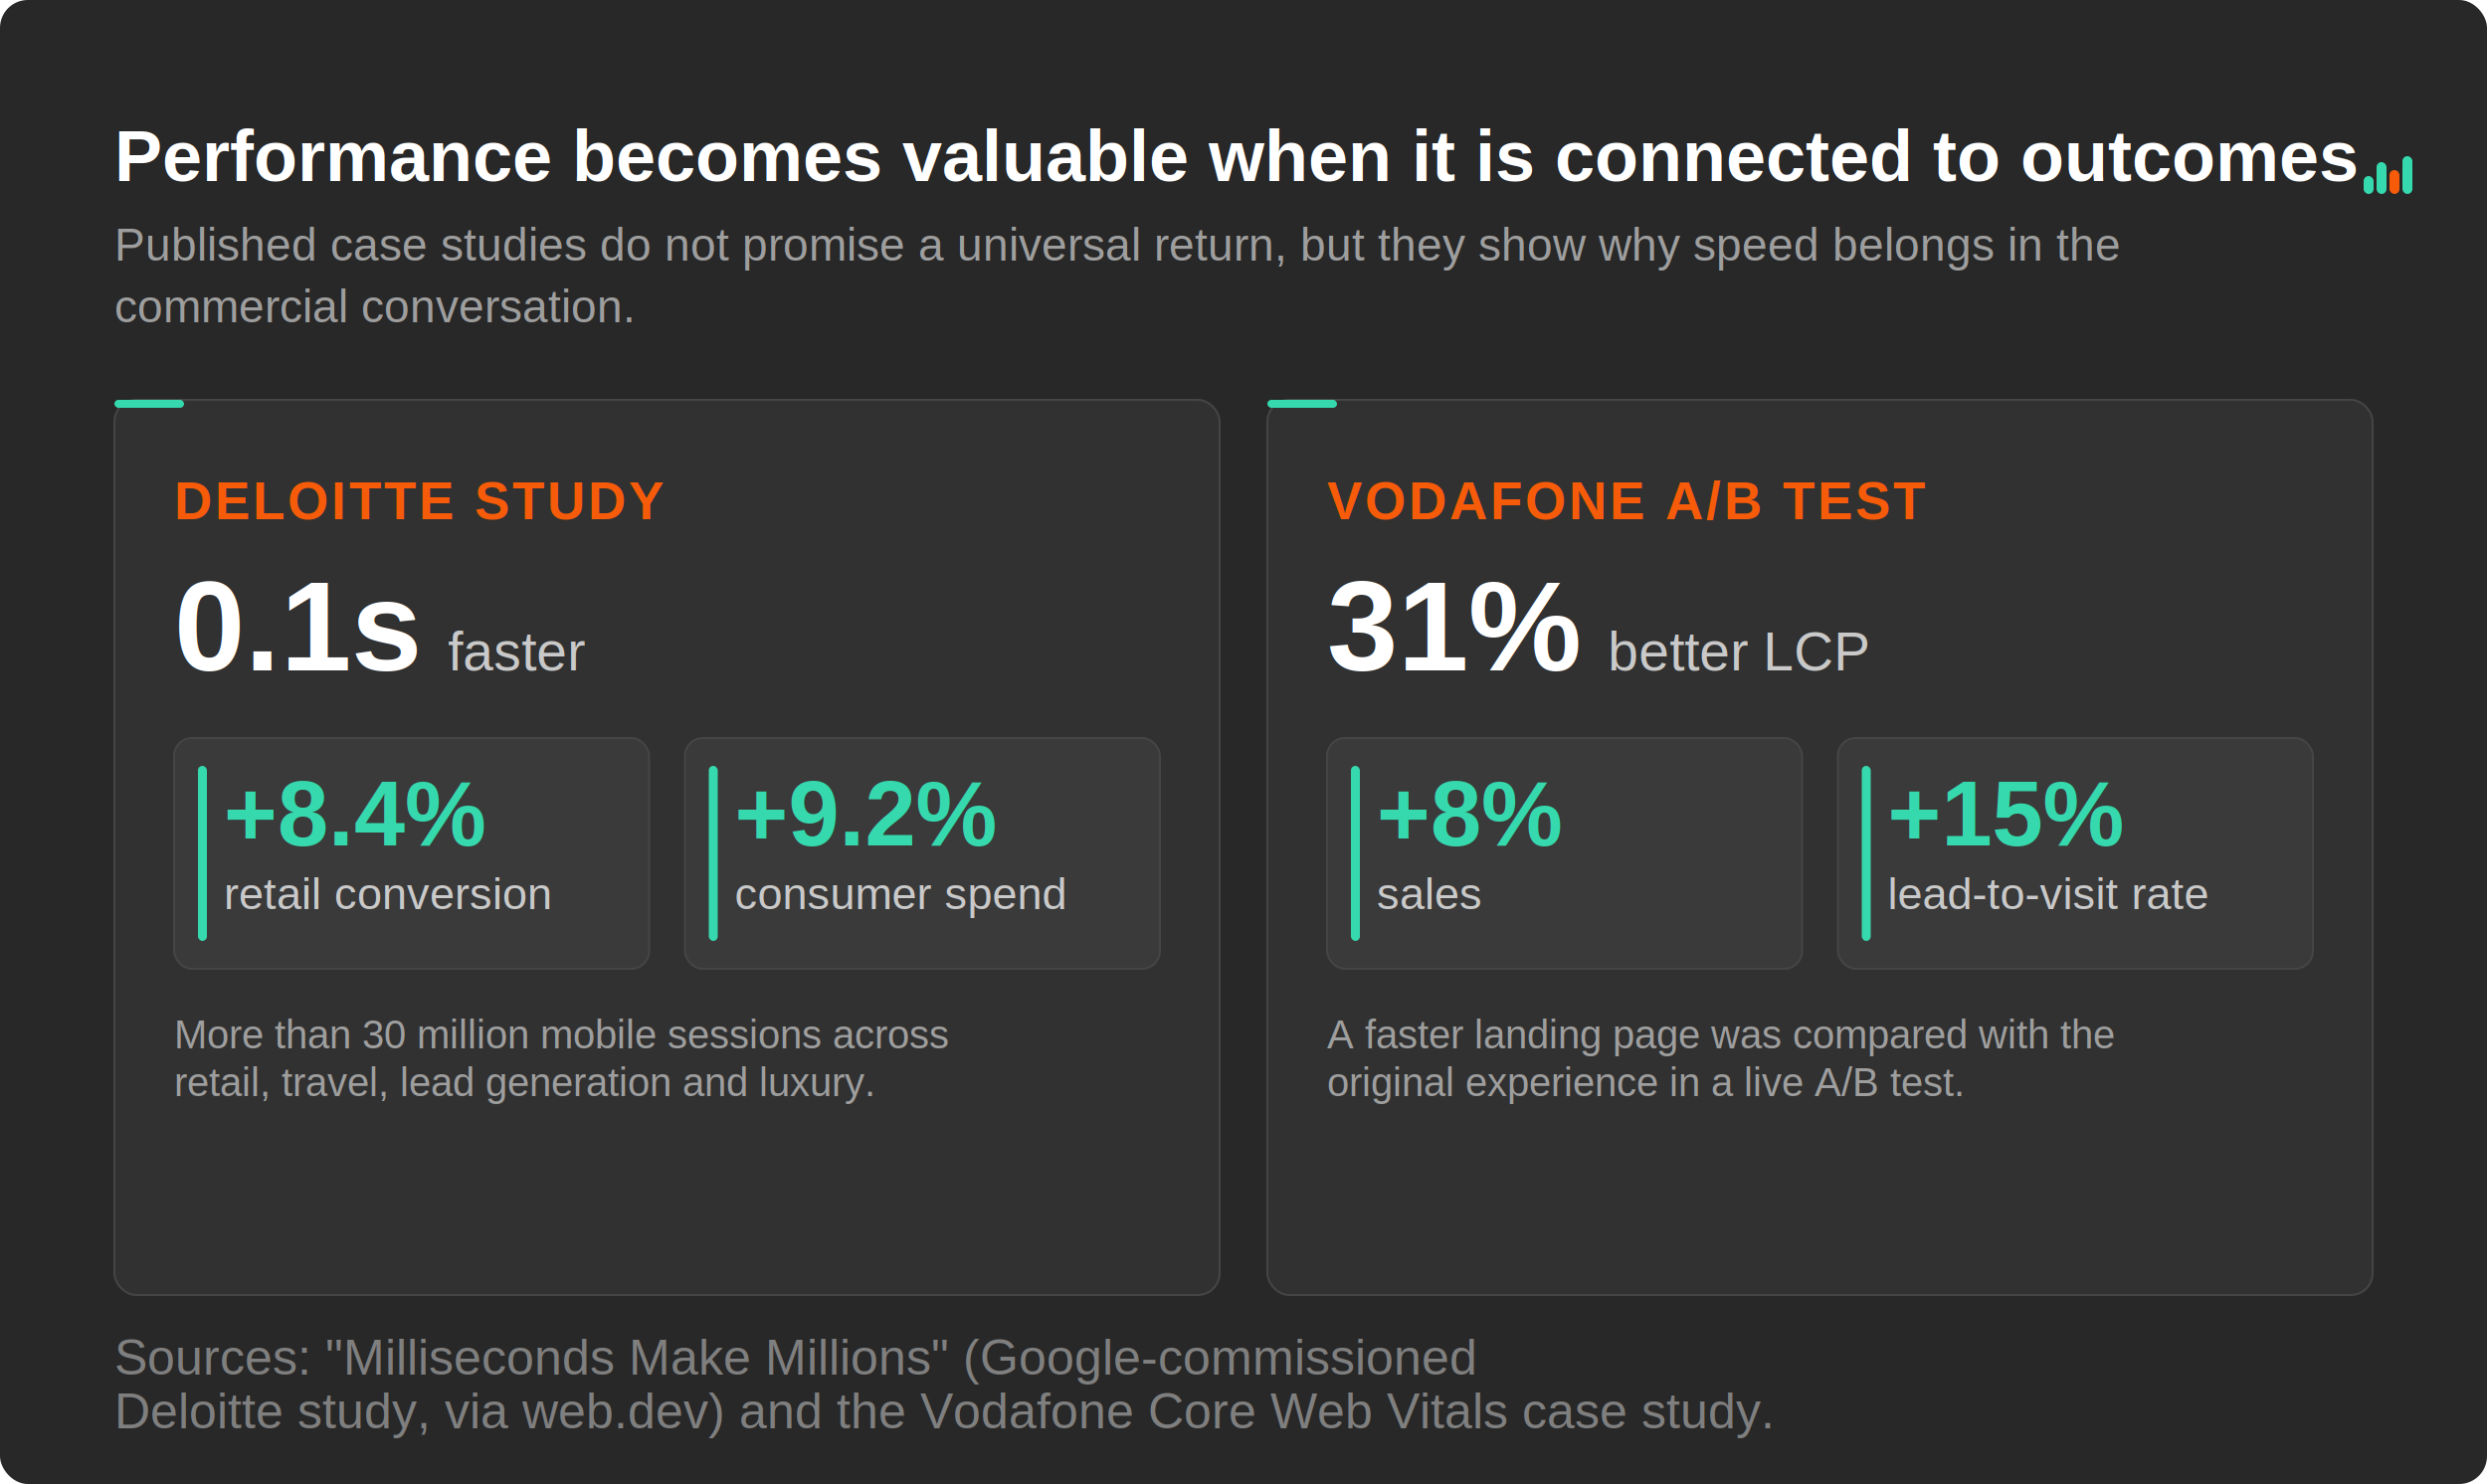
Figure 2. Published performance outcomes reported in the Deloitte/web.dev study and the Vodafone case study.
The SEO argument is often overstated and the business argument understated. Google includes Core Web Vitals within its ranking systems but also makes clear that good scores do not guarantee a top position and that relevance remains fundamental. For a CMO, the more immediate risk is that a page wins the click and then wastes it: the campaign promise arrives before the experience is ready, the customer hesitates, or the interface behaves in a way that feels careless. Performance therefore supports search visibility, conversion and brand trust at the same time, particularly on high-intent journeys where a small amount of friction is expensive.
The acronyms become useful when they are connected to what a customer is trying to do. LCP is the wait before a hero message, product image or store locator becomes useful; INP is the hesitation after selecting a size, filtering a category or submitting a form; CLS is the loss of confidence caused by a button or price moving unexpectedly. Use journey language in marketing reports and keep the technical label in brackets rather than leading with it. This frames performance as customer friction instead of a specialist score.
A one-off Lighthouse test is valuable for diagnosis, but it is not an executive KPI because it represents a controlled lab run rather than the range of conditions customers experience. Use field data from Google Search Console or a real-user monitoring platform to understand performance across devices, markets and page templates. Review mobile and desktop separately and use the 75th percentile rather than the average, which can hide a poor experience for a meaningful group of visitors. Segment the results by journey so that an excellent corporate homepage does not mask weak product, campaign or checkout pages. The baseline should answer who is affected, where the friction occurs and how much valuable traffic is exposed.
Do not begin with a site-wide list of hundreds of recommendations. Start with the templates carrying the most commercial exposure: paid campaign landing pages, product and category pages, retailer locators, quotation tools, lead forms and checkout steps. Combine traffic, intent, media spend and performance data to rank the opportunities, then choose two or three journeys where improvement can be measured. A modest gain on a high-intent template is usually more valuable than a perfect score on a page few customers use.
Analytics tags, consent platforms, personalisation engines, testing tools, chat widgets and advertising pixels all compete for browser resources. Each may have a valid purpose, but their combined effect can slow the journey they were introduced to improve. Give every third-party script a named business owner, a measurable use case and a review date. Require teams to remove or defer tools that no longer justify their cost, and test major campaign additions against agreed performance thresholds before launch. This creates discipline without turning performance governance into a blanket ban on marketing technology.
Redesigns often launch faster than the sites they replace, then become heavier as new features, vendors and content are added. A performance budget defines acceptable limits for page weight, images, JavaScript, third-party requests and Core Web Vitals before development begins. Make those limits part of acceptance criteria and release governance, not a final audit performed when time and budget have already been spent. The purpose is not to block creativity; it is to stop each new initiative from quietly reducing the value of the previous one.
Development teams may implement many of the fixes, but they cannot protect performance alone. Marketing controls campaign requirements and much of the third-party stack; design controls media and interaction patterns; analytics teams provide visibility; product owners decide what reaches the roadmap. T-Mobile secured leadership attention by estimating revenue impact across 100-millisecond LCP bands and then forming a cross-functional task force. The useful lesson is not the precise calculation but the operating model: one shared outcome, clear owners and a route for resolving trade-offs. Performance improves faster when it is managed as a commercial constraint rather than passed between teams as a technical defect.
Capture Core Web Vitals alongside sessions, engagement, revenue, lead completion or add-to-cart behavior wherever your measurement architecture allows it. Compare outcomes for visitors who receive a good experience with those who do not, while controlling for device, channel, market and page type. Use experiments or carefully defined before-and-after analysis for major changes and document the limits of the comparison. This does not require a claim that every millisecond has a fixed monetary value; it creates evidence that reflects your customers and your digital estate. A mature data and analytics setup turn performance from a periodic audit into a measurable business signal.
Use a focused 90-day cycle to turn diagnosis into visible progress. During days 1–30, establish a real-user baseline, map the highest-value templates and agree the commercial metrics that will be watched alongside performance. During days 31–60, prioritise a small number of causes by exposure and impact, then implement fixes such as improving server response, optimizing the main image, reducing render-blocking code, simplifying a third-party script or reserving space for dynamic content. During days 61–90, validate the movement in field data, compare journey outcomes and convert what worked into budgets, launch checks and ownership rules. The cycle is deliberately narrow: it avoids a long transformation programme that produces a large backlog but little evidence. Repeating it quarterly creates a practical defence against regression as campaigns, content and technology continue to change.
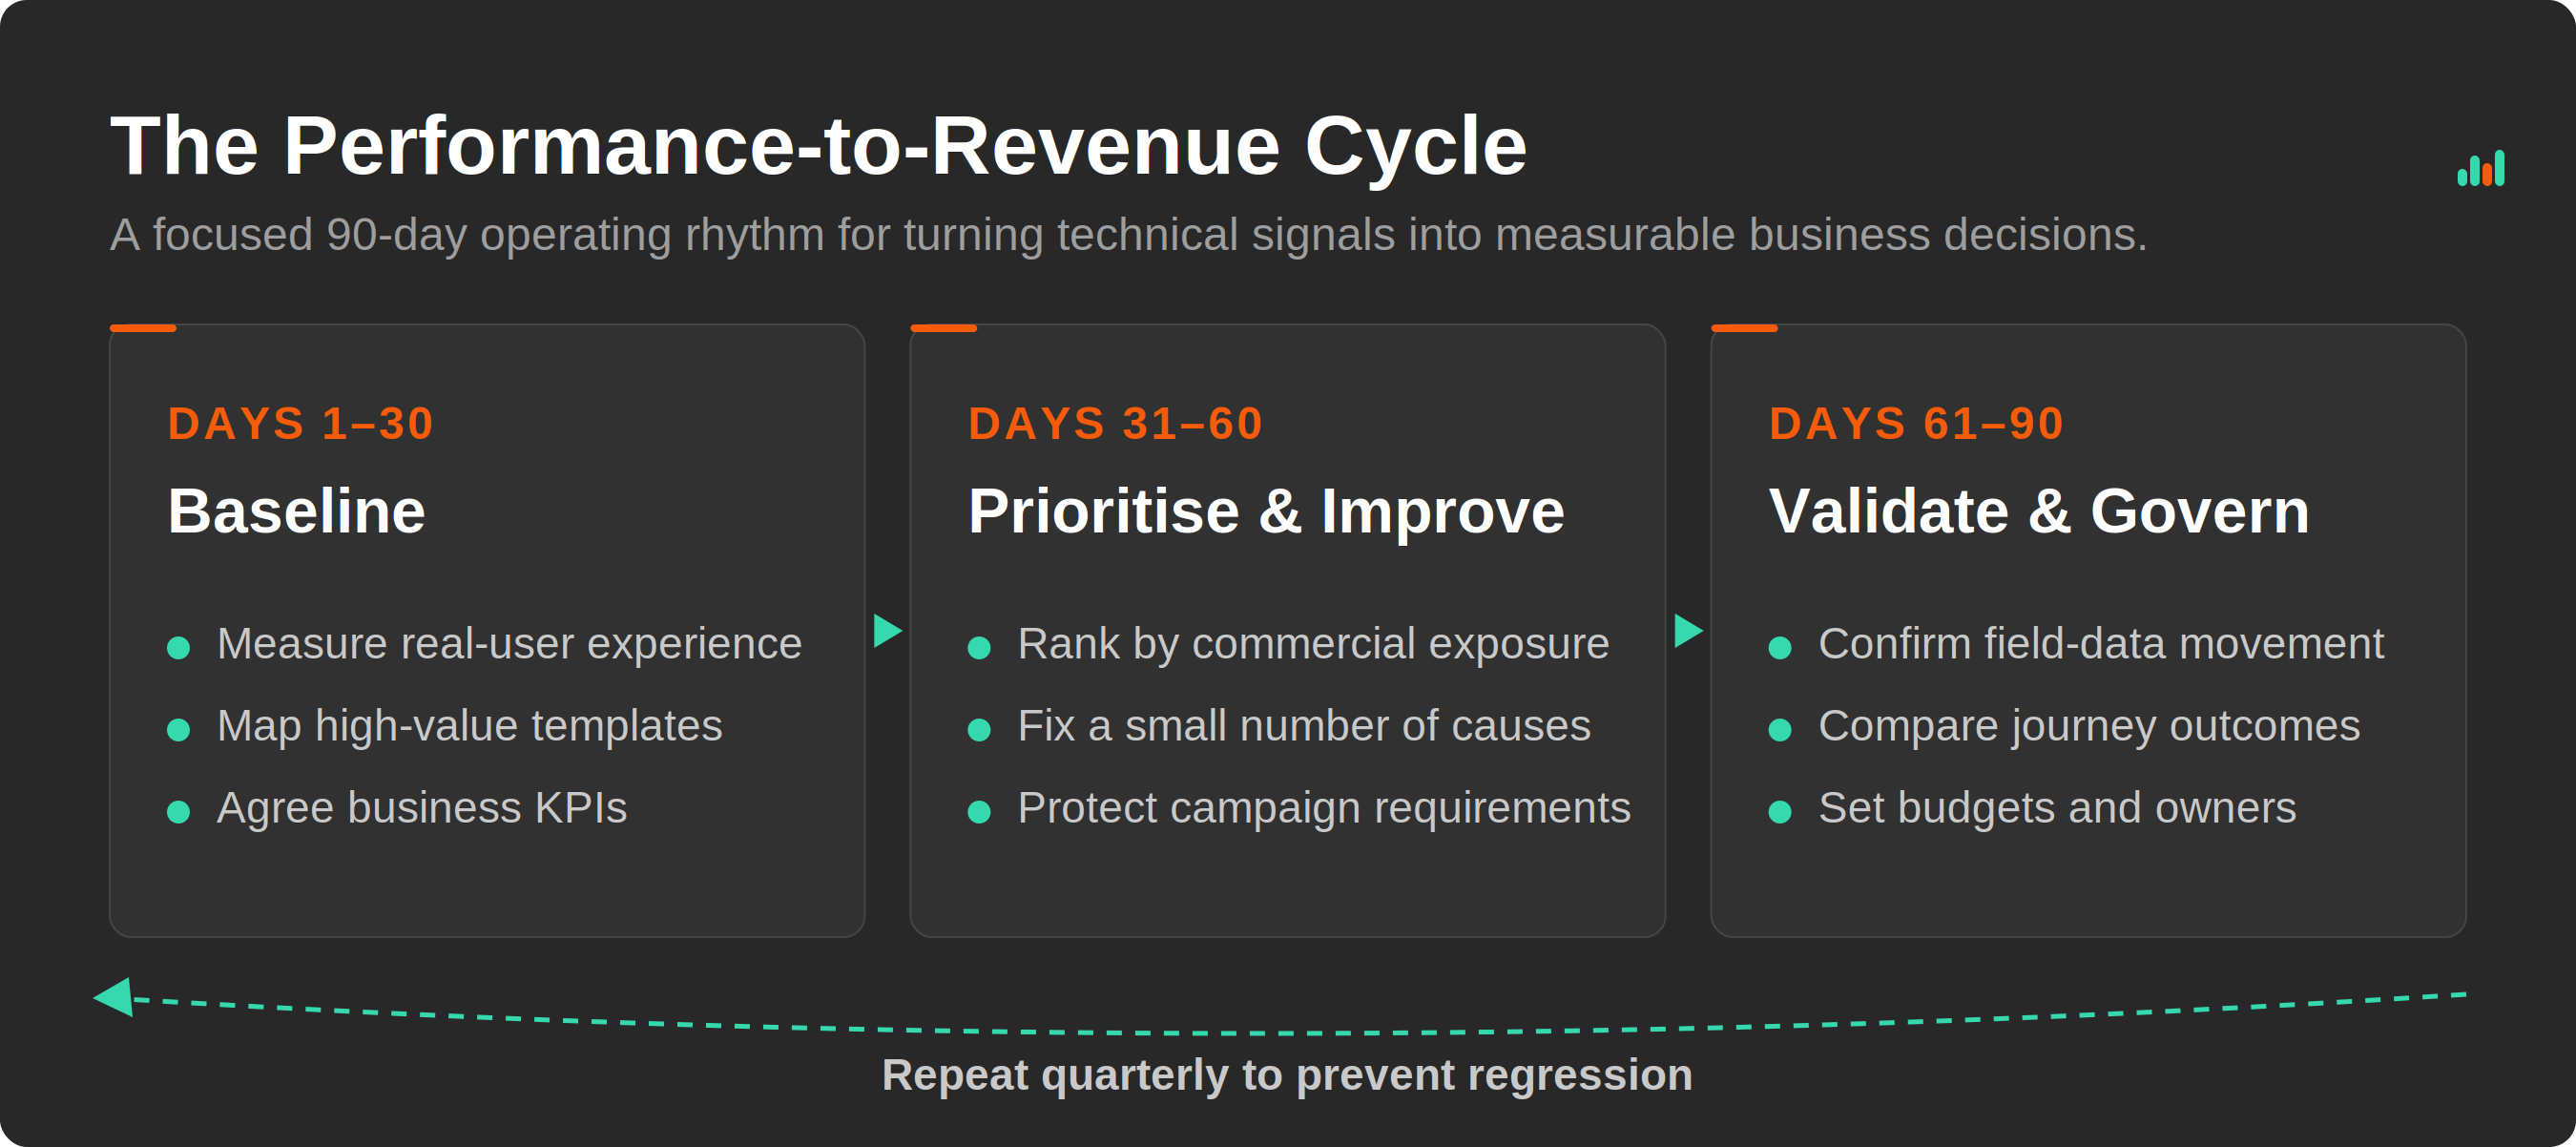
Figure 3. The NMQ Digital Performance-to-Revenue Cycle: a repeatable 90-day model for linking field performance with commercial outcomes.
An executive dashboard should show the percentage of real visits receiving good Core Web Vitals, the commercial journeys at risk, movement over time and the business metrics monitored alongside them. Avoid collapsing the estate into one site-wide score, and do not make 100 in Lighthouse the objective. Google itself warns against chasing a perfect score purely for SEO when other work may be more valuable. The strongest reporting model shows whether customer exposure is improving, whether regressions are controlled and which decision is required next.
Core Web Vitals are not the whole of digital experience, but they provide a disciplined way to see whether a website is helping or hindering marketing. When the metrics are connected to customer journeys, acquisition spend and commercial outcomes, the conversation changes from “Can development make the site faster?” to “Where is performance reducing the value of demand we have already created?” That is the point at which web performance becomes a business metric rather than a technical report. It gives marketing leaders a clearer basis for prioritization, governance and investment.
CMOs do not need to own every optimization, but they do need to ensure performance has an owner, a measurement model and a place in launch decisions. NMQ Digital brings digital strategy, data and analytics and full-stack development together to identify the journeys that matter, remove technical friction and build governance that protects performance as the digital estate evolves. The aim is not a faster website for its own sake. It is a more reliable engine for search, conversion and brand experience.
Is web performance limiting the return on your digital investment? Let’s talk about how to turn Core Web Vitals into a measurable improvement roadmap → Reach out to us
References
Our Blog